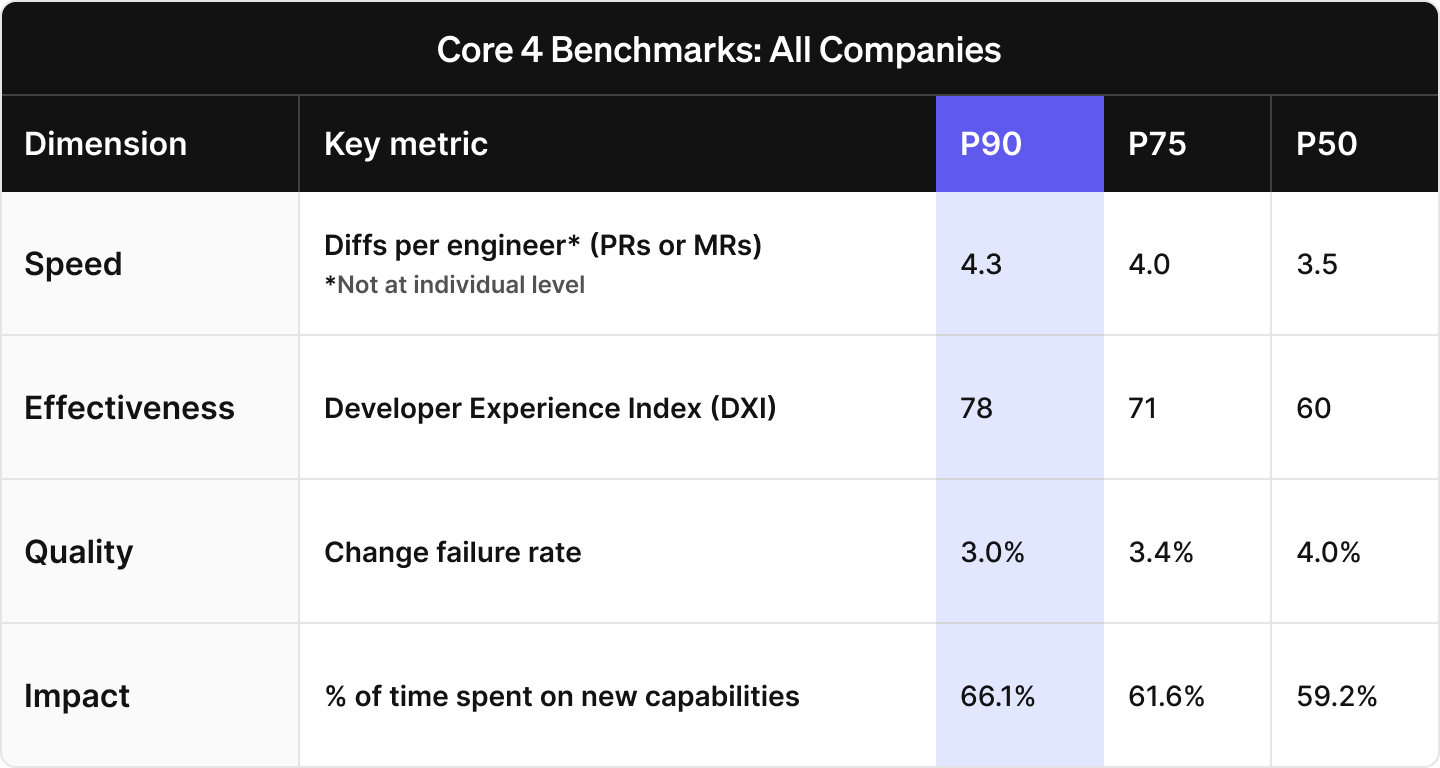
2024 benchmarks for the DX Core 4
Smaller companies are faster, tech companies spend more time innovating, insight into mobile engineering, and more.
Welcome to the latest issue of Engineering Enablement, a weekly newsletter sharing research and perspectives on developer productivity. Subscribe to get new issues delivered to your inbox:
In today’s newsletter, Laura Tacho (DX CTO) shares key findings and commentary from the 2024 DX Core 4 industry benchmarks.
DX recently published a new, comprehensive framework for measuring developer productivity called the DX Core 4. This framework unifies frameworks like DORA, SPACE, and DevEx, and concretely answers the question “what should we measure?” by including a list of key metrics.
We designed DX Core 4 to make it easy for you to get started, and also took into account ease of collection when selecting the metrics.
With DX Core 4 in use at hundreds of different companies, we’re now able to share benchmarking data to help you set high standards, evaluate performance, and guide strategic investment.
You can also download the full benchmarking data set, which includes breakdowns by size and sector.
When looking at the complete data set, here are my most interesting observations. I look at P75 values as a target, and recommend that you do as well. It’s a strong performance goal for any company.
Smaller companies are faster. Both tech and non-tech companies with engineering organizations under 500 developers outpace their counterparts with over 500 developers. Developers at small-to-medium tech companies (less than 500 developers) in the top quartile deliver an average of 4.3 diffs (PRs, MRs) per week. This is in contrast to large non-tech companies, where that number is 3.3.
Tech companies outperform traditional enterprises in almost everything. Tech companies spend more time on new features, have a better developer experience, and have a faster rate of delivery.
Large traditional enterprises are slower but safer. For companies with over 500 developers, non-tech companies slightly edge out their tech company counterparts on Change Failure Rate, meaning that these traditional enterprises have fewer defects escaping into customer-facing environments. In fact, large tech companies with over 500 employees have the highest change failure rate out of our demographic groups.
Change Failure Rate clustering. Even with small differences in Change Failure Rate, the overall values are still very low, ranging from 2.8% to 4.6%. This is a mean average, so some teams are well above that range, but many are below it as well. It’s important to look at Change Failure Rate per service or per application to accurately see where you may be behind the curve.
Tech companies spend more time innovating. In companies of all sizes, engineers at tech companies spend more time on delivering new customer-facing features than their counterparts in non-tech companies. Developers at smaller tech companies spend about 6% more time innovating than their counterparts in larger non-tech companies. This adds up quickly – that’s about two and a half hours per week, per developer. (Laura’s note: Companies need to strike the right balance between innovation and proactive maintenance. Spending 100% of time on new features would mean a lot of pain down the road, so this is one metric where higher doesn’t necessarily mean better.)
Mobile engineers have unique challenges and workflows. We chose to create a benchmarking segment specifically for mobile engineers, as benchmarking data taken from application development teams does not take into account their unique workflows and constraints. Mobile engineers spend between 10 and 20% more time innovating and less time on maintenance work. They also move slightly faster than the rest of the engineering org, and have the lowest Change Failure Rate of any demographic.
Developer experience as a predictive indicator. Better developer experience, as measured by DXI, is associated with more time for innovation, a lower Change Failure Rate, and more diffs per engineer. While measurements in the Speed, Quality, and Impact dimensions are all lagging indicators (meaning that you will see movement on these metrics after there’s already a problem), measuring developer experience can be used as a leading indicator and as an early indicator of future performance problems.
Benchmarking data can help your organization identify performance gaps by comparing your performance against industry standards and top performers. This enables you to prioritize improvements, optimize processes, and align your strategy with proven best practices. Benchmarking data can also help you protect investment when it comes to areas where you are outpacing your peers.
If you are interested in seeing this benchmarking data broken down by size and sector, you can download the full benchmarking data set.
Other resources for the DX Core 4:
Listen to this podcast episode discussing the DX Core 4
Download the slide deck template for reporting on Core 4 metrics
Who’s hiring right now
This week’s featured job openings. See more open roles here.
Lyft is hiring an Engineering Manager - DevEx | Toronto
The Hartford is hiring a Sr Staff Platform Engineer | Multiple cities, US
Pinterest is hiring a Senior PM - Infrastructure | San Francisco, CA
Snowflake is hiring an Engineering Manager - DevEx | San Mateo, CA
Capital One is hiring multiple DevEx roles | US
That’s it for this week. Thanks for subscribing to Engineering Enablement. This newsletter is free so feel free to share it.
-Abi


