

DevProd headcount benchmarks, Q1 2026
Research across multiple industry verticals and engineering team sizes.

Welcome back to Engineering Enablement, the weekly newsletter sharing research and perspectives on developer productivity.
🗓️ In case you missed it: we recently announced DX Annual, our flagship conference for developer productivity leaders navigating the AI era. Go here to learn more and request an invite to attend.
Business leaders understand the ability of centralized developer productivity and internal platform teams to promote better throughput and faster time to market for software features. But, how large should these teams be? What’s the best proportion of developer productivity specialists to other engineers within the company?
To find an answer, our team analyzed data from 39 companies with varying engineering team sizes across a number of industry verticals and looked for trends in organizational composition for teams explicitly dedicated to developer productivity and experience. We found that engineering leaders typically dedicate 2% to 6% of total headcount to centralized developer productivity. However, this ratio is not linear: as organizations scale beyond 1,000 engineers, the percentage of dedicated headcount steadily decreases due to tooling leverage and automation.
I’m excited to continue following these trends as AI efforts become more centralized and embedded in developer productivity teams, as we may see it lead to further hiring and expansion of responsibilities.
Defining the developer productivity umbrella
To ensure these benchmarks weren’t artificially inflated, we used a narrow definition of what counts as a team focused strictly on developer productivity. We only looked at teams that are unambiguously dedicated to internal platforms, developer productivity, and developer experience, and didn’t include teams focused on SRE or infrastructure, for example.
Specifically, we included the following teams in our analysis:
Developer Experience and Productivity: Teams explicitly named “Developer Experience,” “DevEx,” “Developer Productivity,” “Developer Enablement,” or “Engineering Enablement”
Engineering Effectiveness: Teams focused on “Engineering Productivity,” “Engineering Effectiveness,” or “Engineering Excellence”
Internal Developer Platform Engineers: Groups building “Internal Developer Platforms”, “Internal Developer Portals,” “Developer Frameworks,” “Documentation Systems,” “Service Catalogs” or “Developer Tools”
Build & Release Infrastructure: “CI Infrastructure,” “CI Platform,” “Build Infrastructure,” “Build Systems,” “Core Automation Platforms” focused on CI/CD, and “Release Engineering” teams
Developer Education and Support: “Developer Education,” “Engineering Support Organization,” and developer onboarding teams
Test Infrastructure: Teams dedicated to “Test Infrastructure” and “Test Frameworks” (not QA or product testing)
We excluded several categories that often get conflated with developer tooling, such as:
General Cloud Infrastructure: Cloud operations, data center management, storage infrastructure, and network infrastructure teams
Business Platform Teams: “Data Platform,” “ML Platform,” “Analytics Platform,” “Payment Platform,” “Content Platform,” and other product or customer-facing platforms
Site Reliability Engineering (SRE): While SRE teams are critical, they focus on production reliability rather than developer tooling (except when explicitly named as developer-facing)
Security Infrastructure: Security operations, compliance, and infrastructure security teams
Product Infrastructure: Teams building infrastructure for customer-facing products rather than internal tools
Lab Infrastructure: Physical and virtual infrastructure for product testing and validation
Most companies dedicate 4.7% of engineering headcount to developer productivity
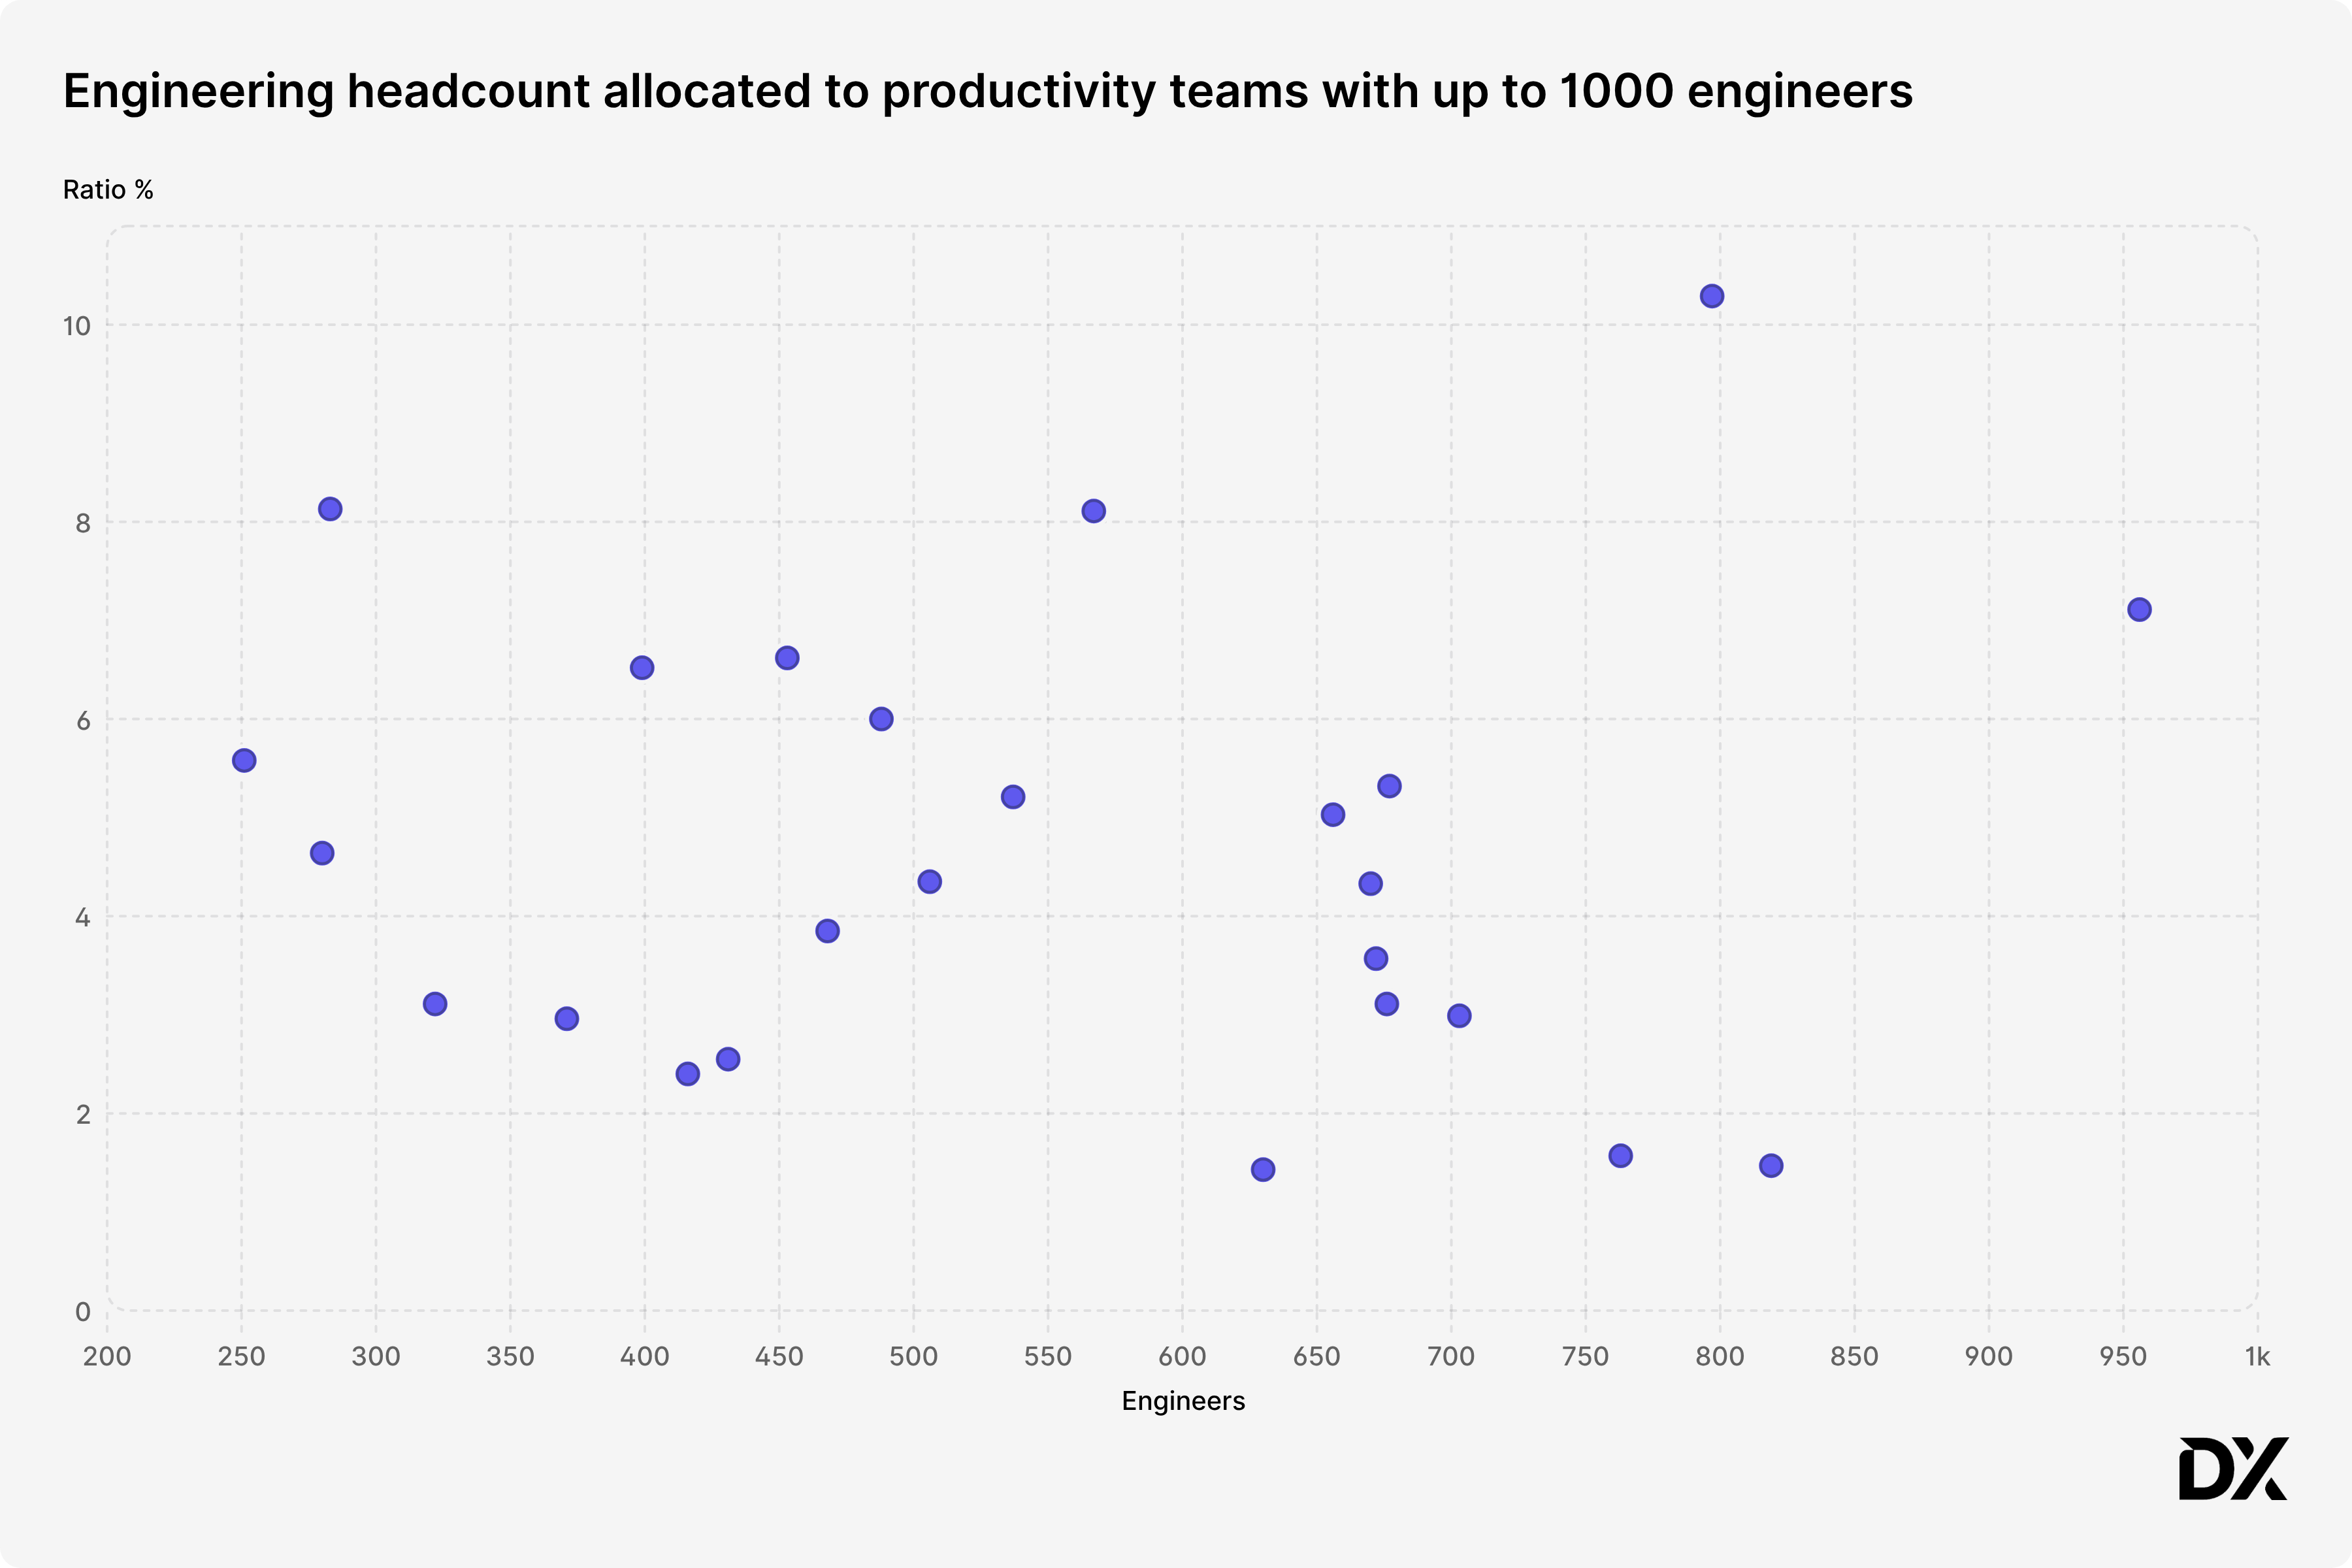
In looking at our first sample of teams that have less than 1,000 engineers, we found that most teams dedicate between 2-6% of their overall engineering headcount to centralized developer productivity functions, with an average of 4.7% across the board. Some range past 8% on the high end, and others range below 2%.
For the average team then, per engineer, that means roughly one productivity engineer per seventeen developers at the high range, or one for every fifty engineers at the lower range. The distribution is shown in the chart below.
These numbers are not surprising, given the variance between company cultures, repository/build architectures, and general attitudes towards productivity. DORA’s State of DevOps reports suggest 10-20% investment between centralized teams and embedded productivity work – our study focuses on centralized, named roles. In general, we’ll find higher investment amongst engineering teams with more complicated deployments (microservices, polyglot stacks, monorepo), and lower investment amongst teams that focus mostly on CI/CD with more monolithic architectures.
When we looked at headcount ratios, we also analyzed team structure: even if two companies have 20 productivity engineers, they may organize them differently. Most organizations distribute their developer productivity team members across 2 to 6 distinct teams. However, some companies take a specialist model, spinning up as many as 15 specialized teams to tackle narrow problems like test optimization or internal portals, while others prefer a single, centralized developer experience or developer productivity unit that handles all enablement tasks under one roof.
Benchmarks by company size and industry vertical
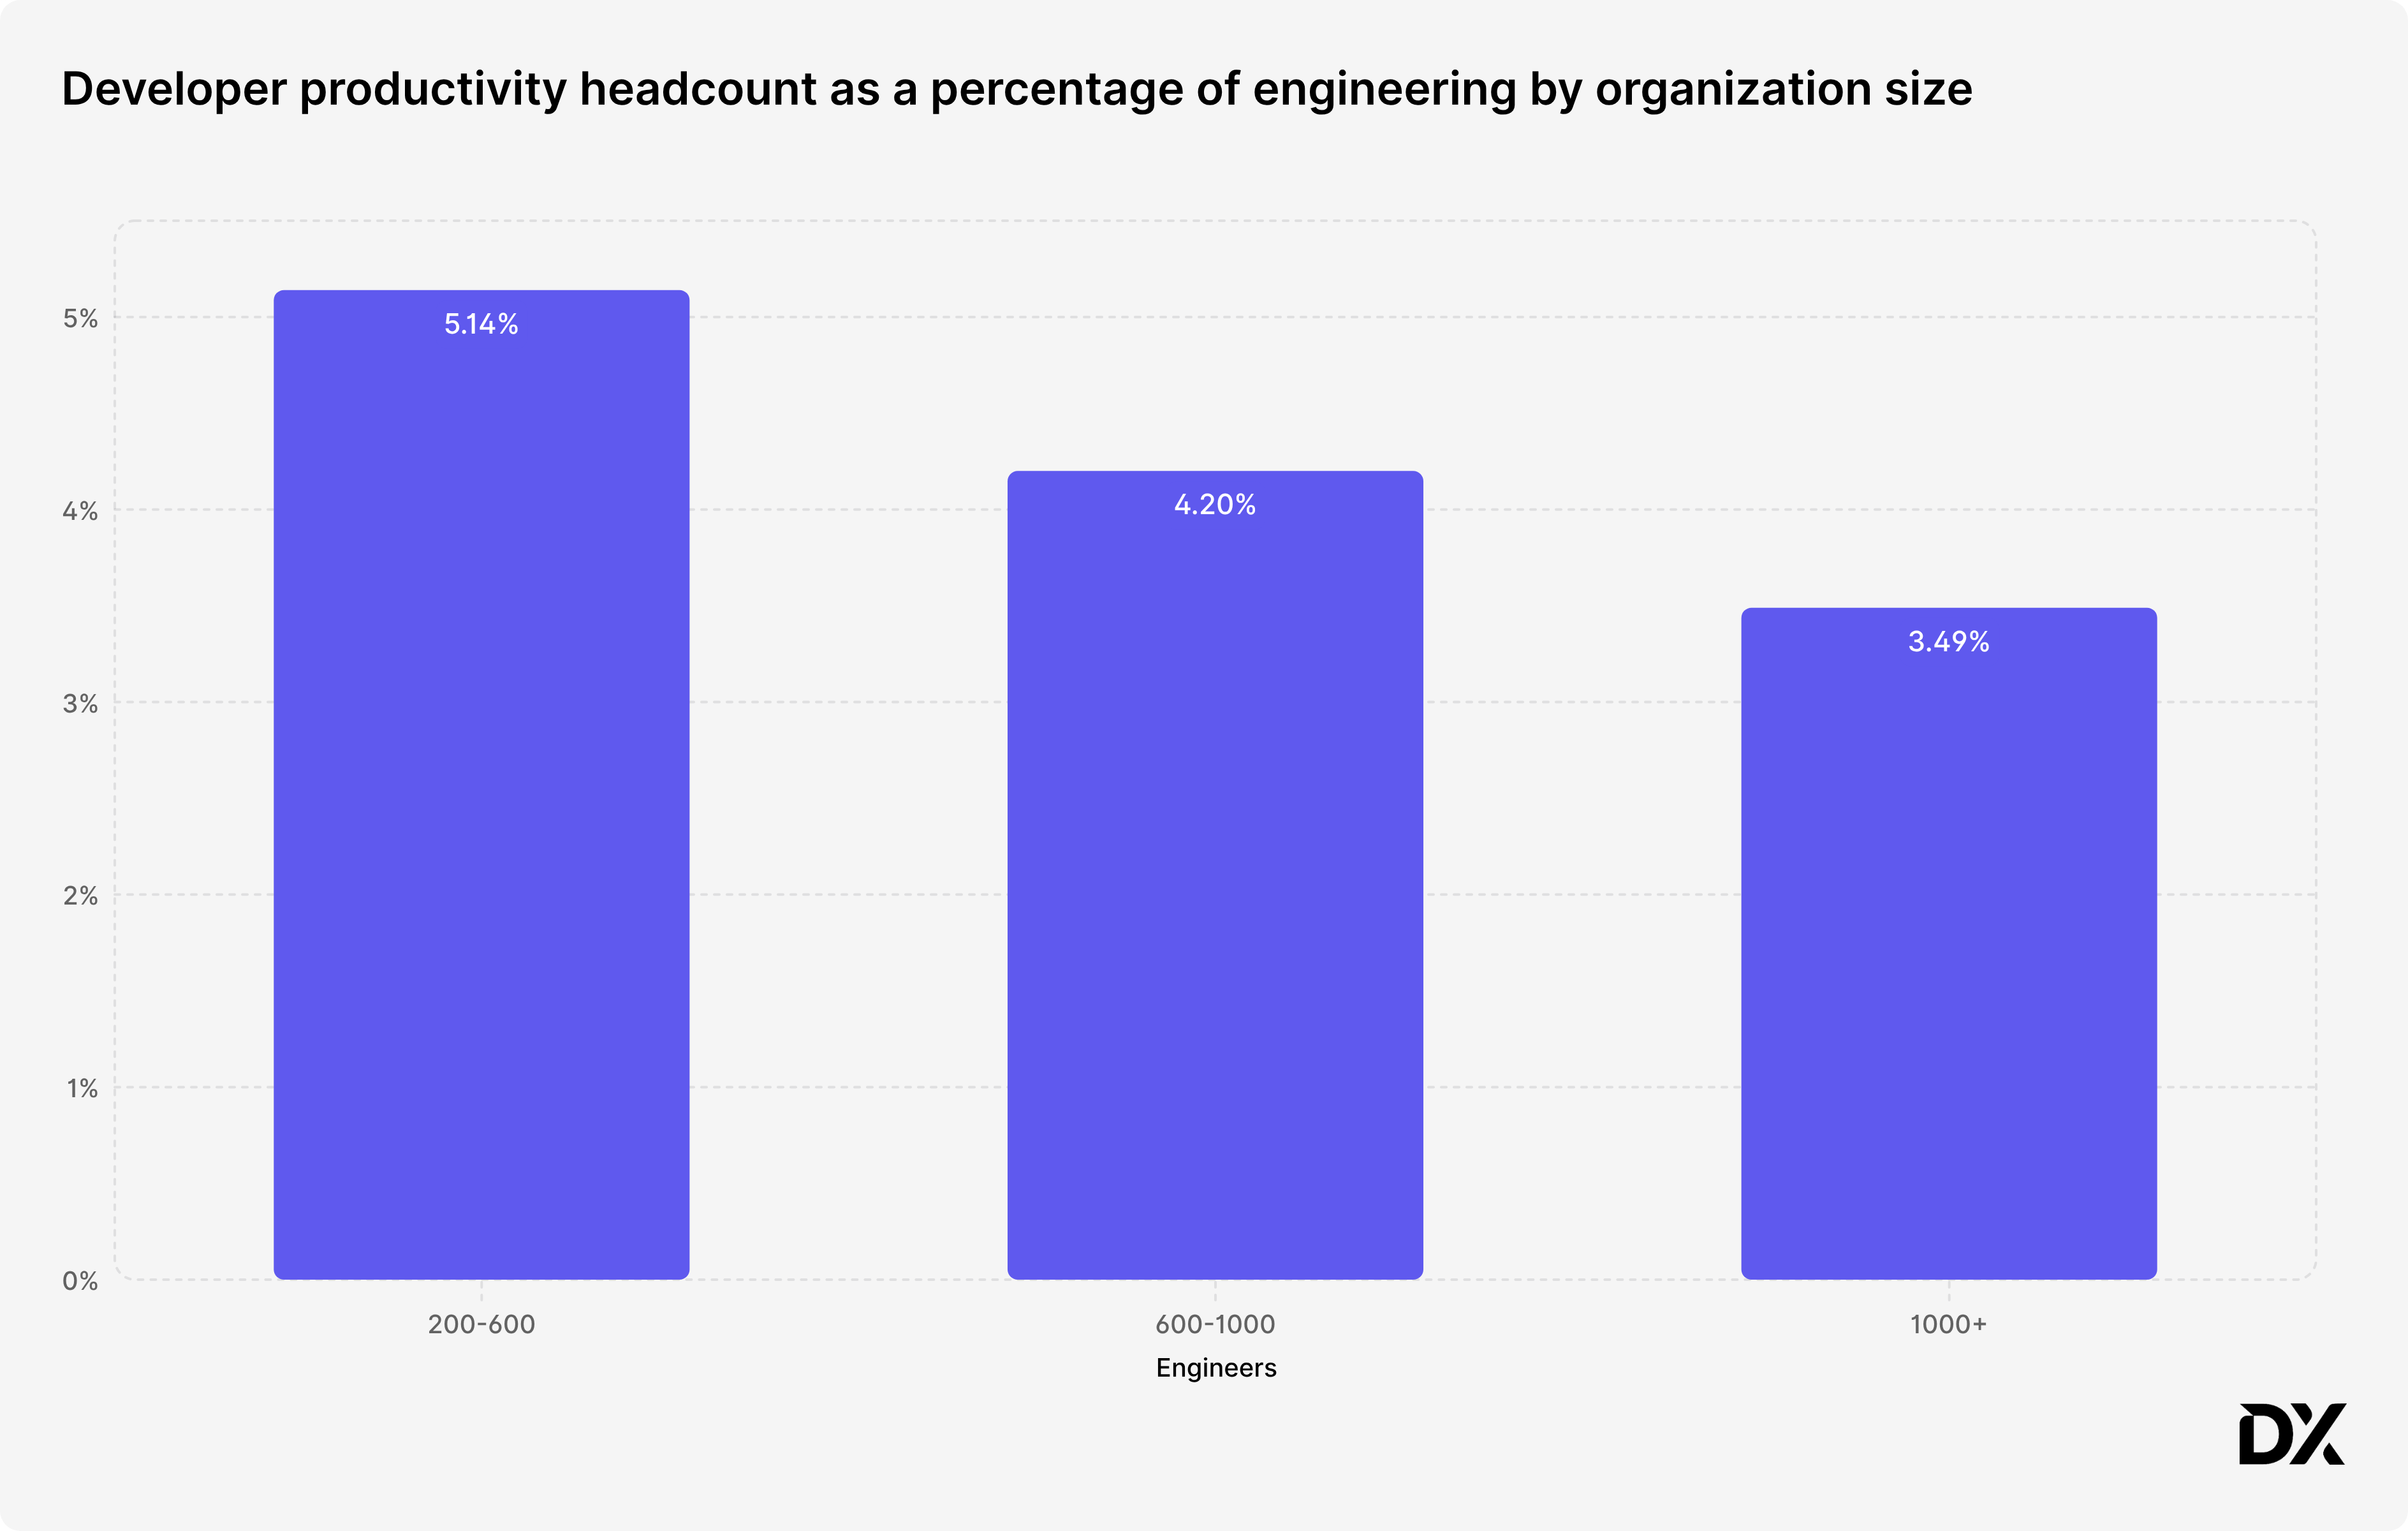
While the 2–6% range is a benchmark, the data shows that investment doesn’t scale linearly. As engineering organizations grow beyond 1,000 people, the percentage of dedicated DevProd headcount starts to drop. This is likely due to diminishing returns in investment, as teams grow and scale, single developer productivity resources can take advantage of more automation, knowledge sharing, tooling, and teamwide collaboration to reduce the need for headcount.
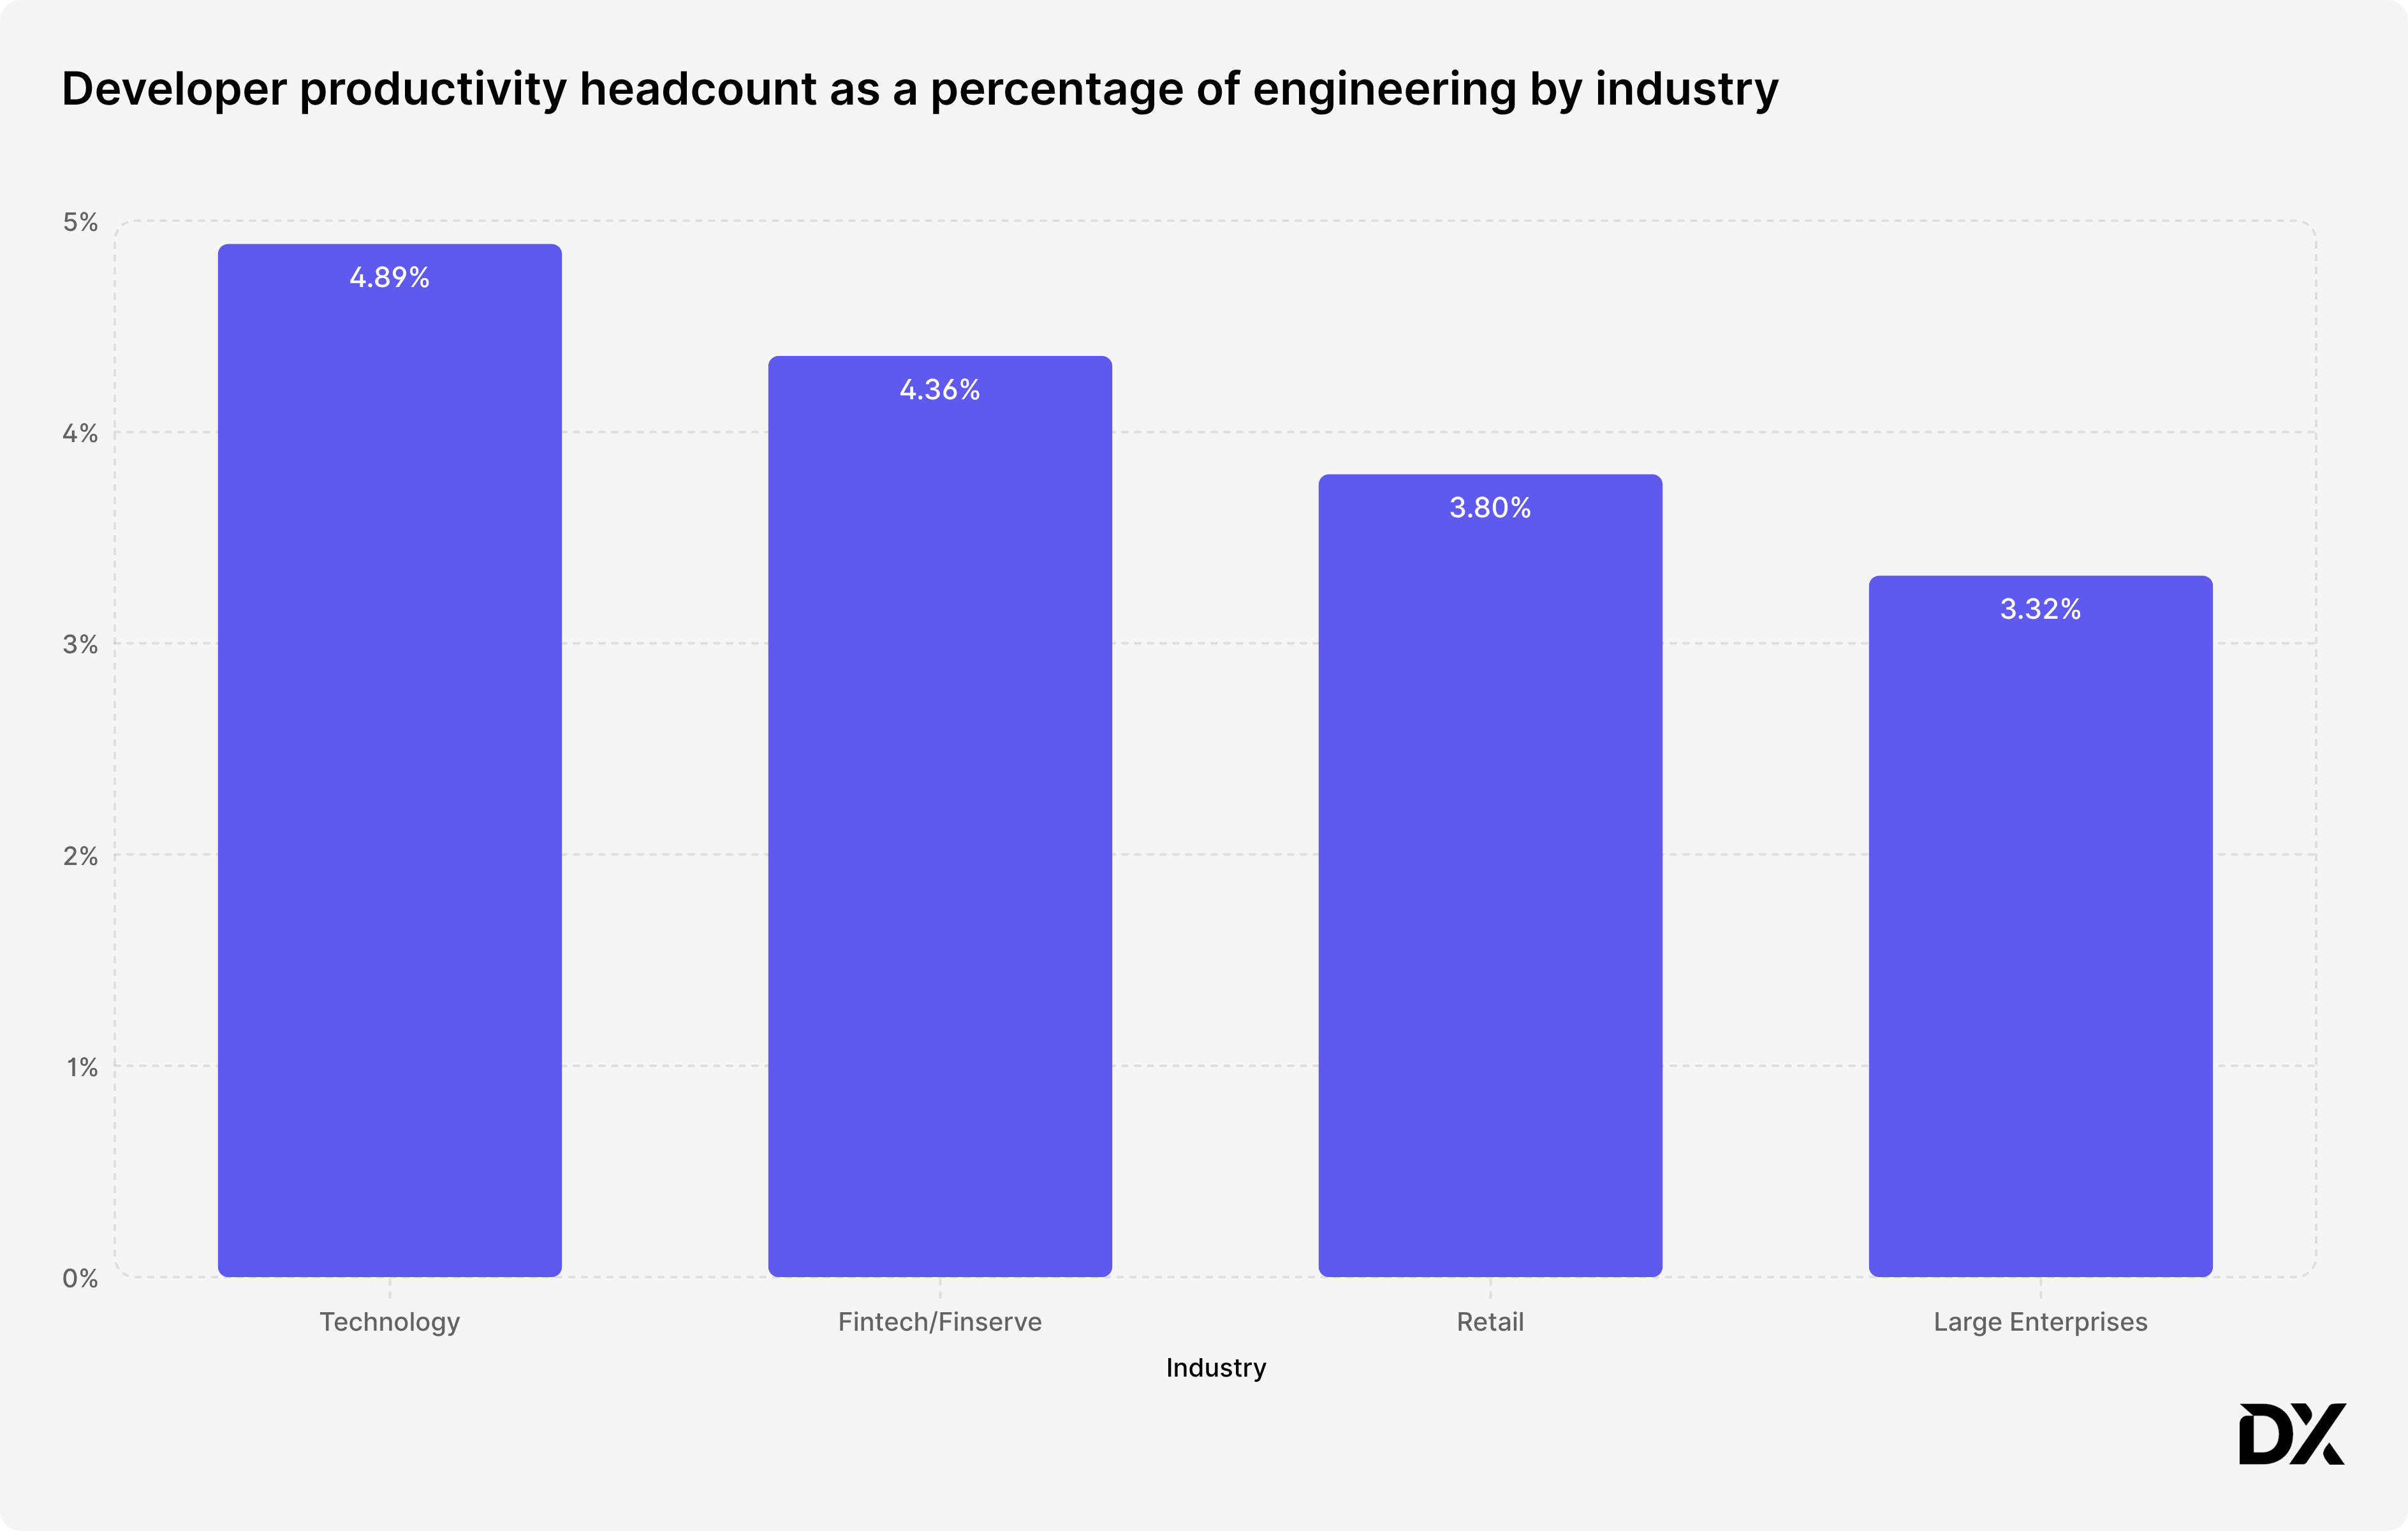
We also saw clear differences in how different industries value DevProd investment:
Technology (4.89%): These companies lead the pack, averaging about one productivity specialist for every 20 engineers. Because software is their primary profit center, shipping features faster directly impacts their bottom line.
Fintech and Financial Services (4.36%): These organizations follow closely behind as they continue to modernize their infrastructure and prioritize engineering speed.
Retail (3.8%) and Large Enterprise (3.32%): These sectors typically show lower ratios, though the latter (large enterprises) may have more to do with the diminishing returns noted in the trends of organizations with 1000+ engineers.
How to use these numbers
These numbers shouldn’t be used as a strict quota, but as a guide for your organizational strategy. The “right” team size is one that balances these industry averages with the specific bottlenecks your developers are facing.
If you are building a new “center of excellence,” use these ratios to set your initial headcount. To ensure you’re getting a real return on that investment, combine these benchmarks with a measurement framework like the Core 4 to track whether your new team is actually removing friction and improving the developer’s day.
This week’s featured DevProd job openings. See more open roles here.
American Express is hiring a Sr. Manager, Digital Product Management - DevProd | Hybrid - London UK
Capital One is hiring a Product Manager - Developer Experience | Plano TX; McLean VA; Richmond VA
Gusto is hiring a Sr. Platform Engineer | Denver, CO; San Francisco, CA; Atlanta, GA; Austin, TX; Chicago, IL; Miami, FL; Seattle, WA
Plaid is hiring a Software Engineer - Platform | New York, NY
Reddit: Staff Software Engineer - Developer Experience | Remote - United States
That’s it for this week. Thanks for reading.
 | A guest post by
|