


Welcome to the latest issue of Engineering Enablement, a weekly newsletter sharing research and perspectives on developer productivity.
🗓 Join our live research panel on September 24 as we introduce CAFE(S), a framework for improving AI agent effectiveness through better context. Register here.
Two numbers from the 2026 Q2 State of AI Impact report have raised a lot of questions for me about the impact of AI on “quality”.
Across a sample of more than 500 companies, code maintainability improved 3.8% between Q1 and Q2. Over the same period change confidence fell 6.1%. Maintainability asks how easy the codebase is to understand and modify. Change confidence asks whether developers trust that their changes won’t break things.
Those two measures have historically moved together. Code you understand is code you feel safe changing. Now they are moving in opposite directions.
Layering in other findings from the report makes the picture even less clear. Documentation quality, code maintainability, and production debugging had some of the biggest improvements in the quarter—all signals we might expect to provide tailwinds to quality. At the same time, review turnaround declined, incremental delivery fell sharply, and pull requests continued to get larger—all signals that we might expect to provide headwinds.
Perhaps quality isn’t simply going up or down. Perhaps different parts of it are moving in different directions.
To help me frame the problem, I went back to a definition of quality that a couple of colleagues and I developed in 2020, several years before generative AI complicated the picture. I wanted to know whether our definition could help make sense of what we’re seeing now.
Turns out, the places where the data appears most contradictory make considerably more sense once we stop treating “quality” as one thing.
What developers mean by quality, before AI could complicate it
In January 2020, Margaret-Anne Storey, Tom Zimmermann and I surveyed 131 developers and 34 engineering managers at Microsoft about how they define productivity and quality, in their own words. (Paper summary here.) We coded the open-text answers inductively, and five dimensions of quality fell out. We called these dimensions TRUCE, which are defined below:
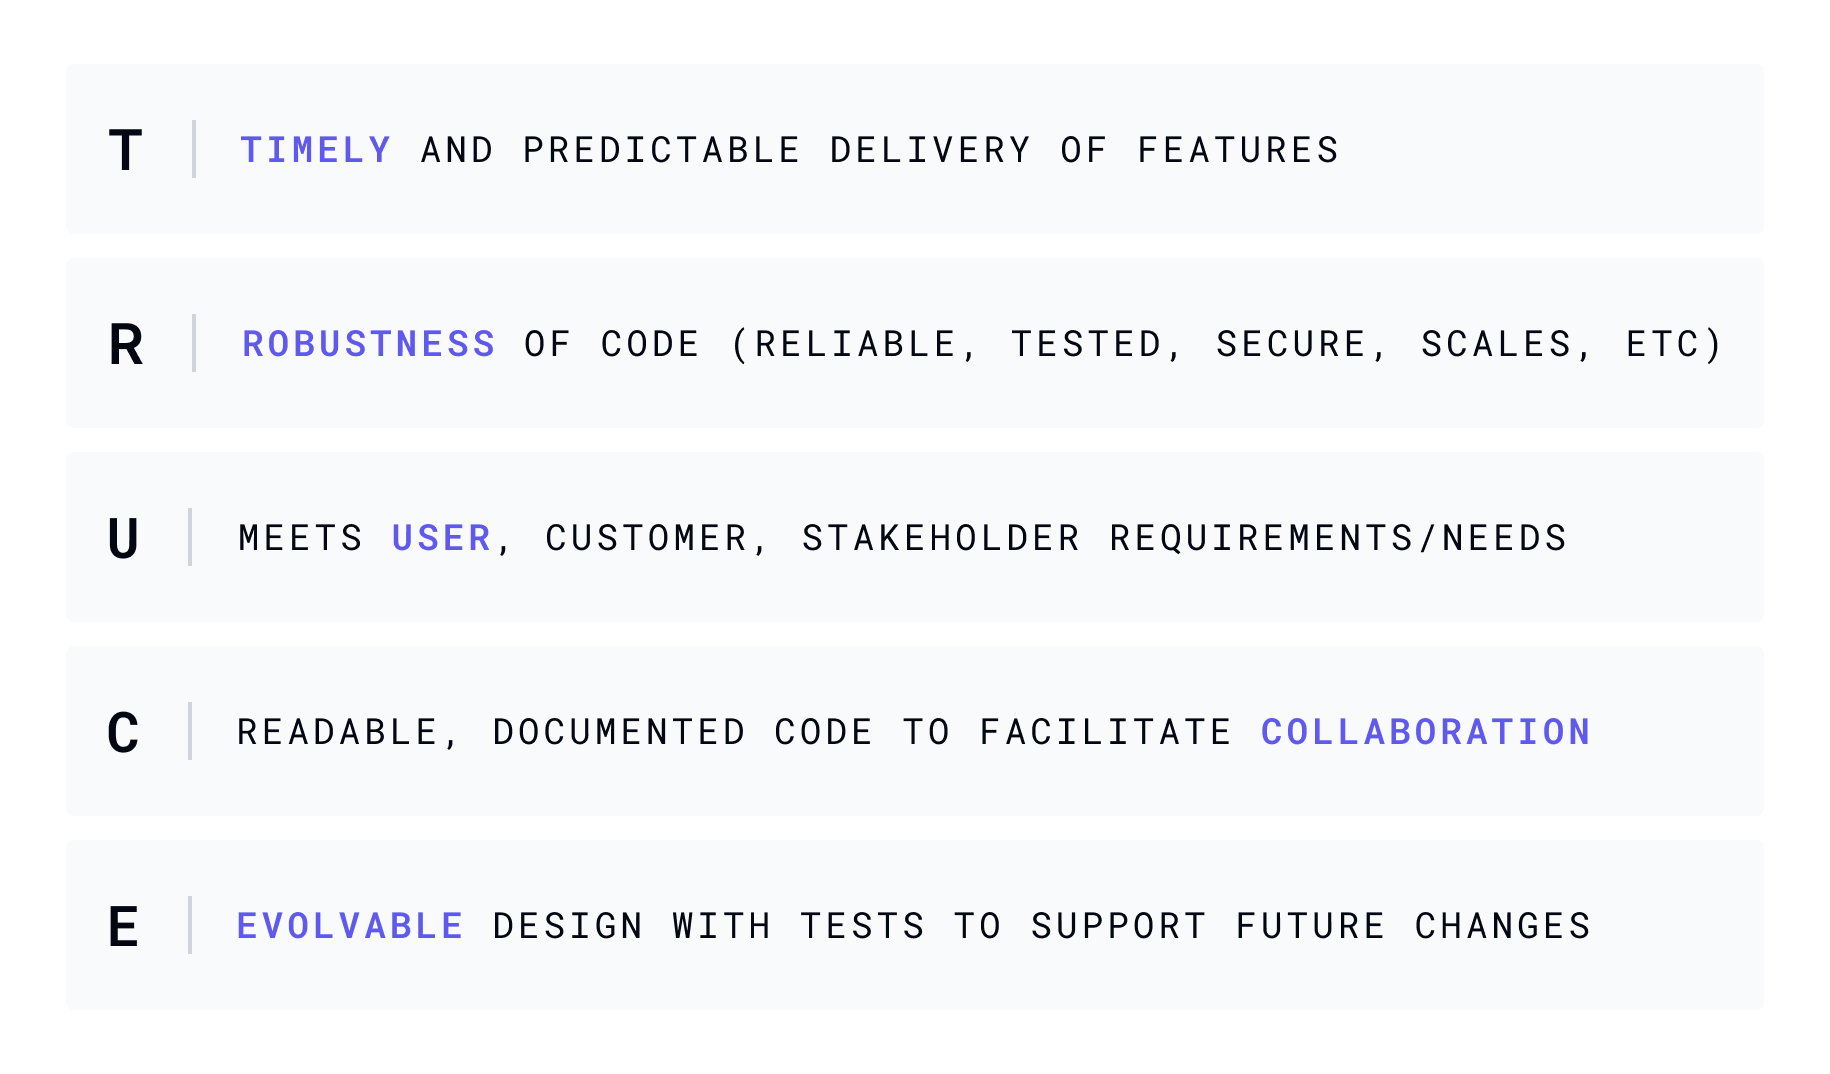
Six years later, TRUCE gives us a useful lens for interpreting what otherwise looks like contradictory evidence about AI and software quality.
Robustness is unsettled, but we can see it
Start with the dimension we instrument best.
Change failure rate volatility widened in Q2, with many organizations now swinging plus or minus three percentage points against a 4% industry benchmark. The distribution of failed deployment recovery time is leaning longer, even though developers’ experience with production debugging improved slightly.
In other words, teams report getting better at diagnosing production problems while recovery outcomes are becoming more variable.
It’s important not to turn correlation into causation here. This data doesn’t tell us that AI created volatility, or even that AI amplified it. What we can say is that robustness is becoming less predictable during the same period in which AI-authored code has accelerated dramatically.
Robustness itself isn’t mysterious; we know what we’re trying to observe. Many metrics exist to try and measure robustness: failure rates, recovery times, incidents, defects, test outcomes, and more. We can debate exactly which measures are best, but when robustness changes, we have a reasonably mature vocabulary for describing what happened.
Hold onto that, because robustness turns out to be the exception. The dimensions that follow are roughly ordered by how well we can measure them, and as that measurement thins out, something consistent happens: the dimension stops behaving like one thing. Whether those two facts are related is a question I want to come back to.
Evolvability is splitting into two things
TRUCE derived evolvability from developers defining quality as “Easy to test, easy to change.” It’s natural to assume that code you understand is code you can feel safe changing. Recent academic research suggests something different may be happening when we zoom out from individual code changes to the systems they become part of.
In More Code, Less Reuse, Huang and colleagues compared pull requests generated by AI agents with those written by human developers. They found that AI agents were more likely to miss opportunities to reuse existing code, introducing greater redundancy. Interestingly, reviewers still tended to respond neutrally or positively to the AI-generated contributions. The authors describe this as a disconnect between the “surface-level plausibility” of the code and the technical debt accumulating underneath it.
Another recent study makes the distinction even clearer. Needle in the Repo evaluated 23 AI coding configurations on repository-level tasks designed to test maintainability, not just whether the resulting code worked. Across those configurations, 13.3% of outcomes passed every functional test while still failing the study’s structural maintainability criteria. Performance was especially poor on architectural concerns such as dependency control and responsibility decomposition.
Both findings point toward the same distinction. A piece of code can be easy to understand. It can work. Reviewers can even think it looks good. But the system it belongs to can still become harder to evolve.
The emerging pattern is that locally good code doesn’t guarantee a healthy system. Generated code may be perfectly understandable in isolation while duplicating something that already exists, introducing an unnecessary dependency, or putting functionality in a place that makes the broader system harder to change.
And that brings us back to the numbers I started with. Maintainability improved 3.8%. Change confidence fell 6.1%. Perhaps those measures aren’t disagreeing after all. They may simply be looking at different parts of evolvability.
Collaboration is splitting too
One of my favorite definitions of quality from the TRUCE paper came from a developer describing collaboration, one of the least frequently mentioned dimensions:
“Quality is code or solutions that solve a problem and don’t need undue maintenance or lengthy handoff. If I get hit by a bus and the company can still easily use the code I’ve written, I’ve made a quality solution.”
We wrote at the time that enabling collaboration or reuse by others “is often invisible and hard to measure,” which likely explains why it was a less frequently mentioned dimension, “and yet it is very important.” I did not expect that sentence to age the way it has.
This is where the data gets strange. Documentation quality was among the clearest wins in the quarter. That matters for collaboration. Documentation supports handoff, comprehension, and the ability of someone else to pick up your work.
At the same time, review turnaround declined. Incremental delivery, which asks whether developers work in small, testable changes, showed the sharpest decrease of any driver. Median PR size nearly doubled over the year, increasing the amount of unfamiliar code developers need to understand at once.
So we have better documentation attached to larger changes that are harder to review, written increasingly by something that isn’t on the team. Documentation quality and shared understanding aren’t the same thing. AI can document what the code does without transferring the reasoning that led to it. It can make handoff easier while making shared ownership harder.
That’s what makes the bus-factor definition feel so different to me now. AI may be improving the explicit artifacts that support handoff while making the implicit knowledge surrounding the work more difficult to maintain.
The collaboration dimension that only 17% of developers thought to mention in 2020 suddenly looks much more important. And we said at the time that we couldn’t see it very well.
Timeliness is not the same thing as speed
Only 7% of developers named timeliness as a dimension of quality in 2020, the lowest of the five dimensions. It is now the site of perhaps the cleanest decoupling in the data.
Median normalized PR Throughput rose 37% over four quarters. Deployment frequency is up across nearly every segment. However, over the same period, developers’ perceived rate of delivery was flat.
That looks contradictory only if we assume delivery speed and timeliness are the same thing. Timeliness was not intended to be a pipeline property. It was about whether what was needed arrived when it was needed.
AI can increase the amount of code flowing through a system without changing how quickly an engineer feels able to get the thing that matters into a customer’s hands. More PRs can run into slower reviews. Faster implementation can expose bottlenecks in testing, deployment, requirements, or coordination. Additional output can simply create additional work downstream.
The pipeline got measurably faster. The felt experience of delivering on time did not.
Once again, TRUCE makes the apparent contradiction easier to understand. Our delivery-speed metrics and our experience of timeliness are measuring related things, but they aren’t measuring the same thing.
User needs is the dimension we still can’t see
It would be a stretch to say much of anything about AI’s impact on this dimension from the available data. That is itself a finding.
The closest available proxy in the Q2 data is perceived software quality, and it says something counterintuitive. Traditional industries and financial services, the slowest-moving segments on throughput, report the highest perceived quality.
That is self-reported and may say as much about expectations as about software, so I’d stop short of any claim stronger than this: speed and perceived quality are not moving together.
I also went looking for external research on whether the people who use software are experiencing it differently as AI authorship climbs. I came up mostly empty.
There is a great deal on defect rates, vulnerability counts, code quality, and QA workload. We have remarkably detailed telemetry about how much code AI writes, how quickly pull requests move, how frequently teams deploy, and how often changes fail. We know considerably less about whether the resulting software is actually solving people’s problems better.
That’s a striking asymmetry.
One developer in the study told us “Quality is doing what the customer wants.” Four years into this shift, we can measure changes in the machinery of software production with extraordinary precision while remaining largely blind to what may be the most important dimension of quality: did the thing we built serve the people using it?
Quality was never just about the code
Put the five dimensions back together and the story isn’t that AI is improving quality. It also isn’t that AI is destroying it. The story is that “quality” was never a scalar.
Seen this way, the maintainability/change-confidence paradox that started this piece doesn’t look like a paradox anymore. It looks like exactly what we should expect when a multidimensional construct is being pushed in different directions at once.
Six years on, I don’t think AI makes TRUCE less useful. If anything, it makes the framework more useful by reminding us what we’re actually trying to preserve. We still want software that is robust, evolvable, collaborative, timely, and serves the people using it.
What may be changing is where we need to look to understand whether we’ll get those things.
Reuse requires knowing what already exists in the codebase. Review requires knowing what a change was meant to accomplish. Evolvability requires knowing why the system is structured the way it is. Handoff requires knowing what the previous person was thinking. Serving user needs requires knowing what problem the software was supposed to solve in the first place.
None of that knowledge necessarily lives in the code.
Margaret-Anne Storey, my TRUCE co-author, has arrived somewhere similar from a different direction. Her triple debt model separates technical debt, which lives in code, from cognitive debt, which lives in a team’s shared understanding, and intent debt, which lives in the artifacts recording what a system is for.
Her argument is that AI may reduce one kind of debt while accelerating the others, and that code is no longer necessarily the binding constraint on software health.
Her model maps to the findings we just walked through. Technical debt is visible in the evolvability problem. Cognitive debt shows up in the collaboration split. And intent debt helps explain why it is so difficult to know whether a system is meeting real user needs, the dimension we can barely see at all. Hers is a conceptual model rather than an empirical one, so I’d call this convergence rather than confirmation. But two frameworks built for different purposes landed on the same three places.
There’s a small irony worth noting. When Mansi Khemka and I asked developers in 2023 what they most wanted AI help with, authoring and refactoring code ranked fifth, at 25%. Documentation ranked third at 37%.
Documentation is now one of the clearest quality wins in the data. Refactoring is one of the structural signals moving most sharply in the other direction.
I wouldn’t read too much into a single comparison. But it is interesting to me that the dimension holding up best is the one where the tooling matched what developers said they wanted.
Which brings me back to the artifact itself. We have spent decades learning to evaluate code. It is worth asking whether code is still the thing that carries the most information about whether these five dimensions will hold.
Code is not the only artifact worth evaluating
For most of software’s history, code was the currency of software engineering. A developer understood the requirement, carried some model of the architecture in their head, knew what neighboring systems did, made a series of design decisions, and eventually expressed those decisions as code. That made code an unusually information-rich artifact, and it is why evaluating the code was a critical way to evaluate the work.
That is changing. The Q2 report found that 52.7% of code is AI-authored, up from 24% in Q4 2025 and 34% in Q1 2026. Increasingly, a developer doesn’t translate everything they know directly into code. They express an intent, provide some representation of the relevant context, and ask a machine to produce the implementation.
Intent and context aren’t quite the same thing. Intent is what a person ultimately wants to accomplish. That intent must then be translated into context, which is the information that represents the task, its constraints, and the surrounding knowledge. More of the knowledge a developer once carried implicitly now has to be externalized before the work can begin.
TRUCE still gives us language for evaluating the artifact at the end of that chain, and AI doesn’t change that. What concerns me is that the end of the chain is becoming a late place to look. As development shifts from writing implementations toward expressing intent, more of the conditions that determine all five dimensions are set before any code exists.
We know how to ask whether the artifact is good. We’re only beginning to develop the vocabulary for asking whether the context that produced it was good enough to begin with.
That’s it for this week. Thanks for reading.
-Brian
In got stuck in the robustness section. You note that teams report getting better at diagnosing production problems while recovery outcomes are becoming more variable. Both of those can be true at the same time, but unfortunately MTTR has no way to show it because it collapses a sequence of intervals into a single duration.
If you remember the Cloudflare incident (Nov 2025) and go through their postmortem: 5 hours and 38 minutes end to end. Roughly 2 hours went to working out what was happening. The mitigation was reverting a config file, so the interval after diagnosis behaves nothing like the intervals before it. Flattening all the intervals hides which lever you're actually missing.
At Unleash, we ended up naming it "mean time to neutralize" (MTTN), as the span from diagnosis to impact reaching zero, whether or not the underlying bug is fixed yet.
The companion metric is the gap between users stopping hurting and the real fix shipping. I find it fascinating because it's the rare incident duration that improves as it gets wider. Why? Because it means someone wrote the fix without the graph bleeding underneath them.
More context about MTTN from our blog: https://www.getunleash.io/blog/mean-time-to-neutralize
The maintainability up, change confidence down split is fascinating. Locally clean code inside a system that's getting harder to reason about is exactly how it feels on the ground right now.