

Applying the Core 4 framework (Part 2)
How to quantify the impact of developer productivity initiatives using the Core 4.


Welcome to the latest issue of Engineering Enablement, a weekly newsletter sharing research and perspectives on developer productivity.
Tomorrow Laura and I are hosting a discussion on how to use developer productivity data effectively. Register to join us here.
Previously, DX’s CTO Laura Tacho shared a template for capturing the Core 4 metrics. This week she’s explaining how to use the Core 4 framework to link developer productivity projects to business outcomes.
Here’s Laura.
Platform and Developer Productivity teams often struggle to communicate the impact of their projects. Phrases like “tech debt repayment” and “workflow improvements” aren’t clear enough for most non-technical stakeholders to understand what’s actually getting done. That’s why we recommend using the Core 4 metrics, which can be used to directly link efficiency projects back to core business impact metrics that resonate with everyone.
Here, I’ll describe how to use the Core 4 metrics to quantify the impact of developer productivity efforts. Then I’ll describe how to use benchmarks to help contextualize the improvements made.
Using the Core 4 metrics
To illustrate how to use these metrics, let’s look at a real organization’s results.
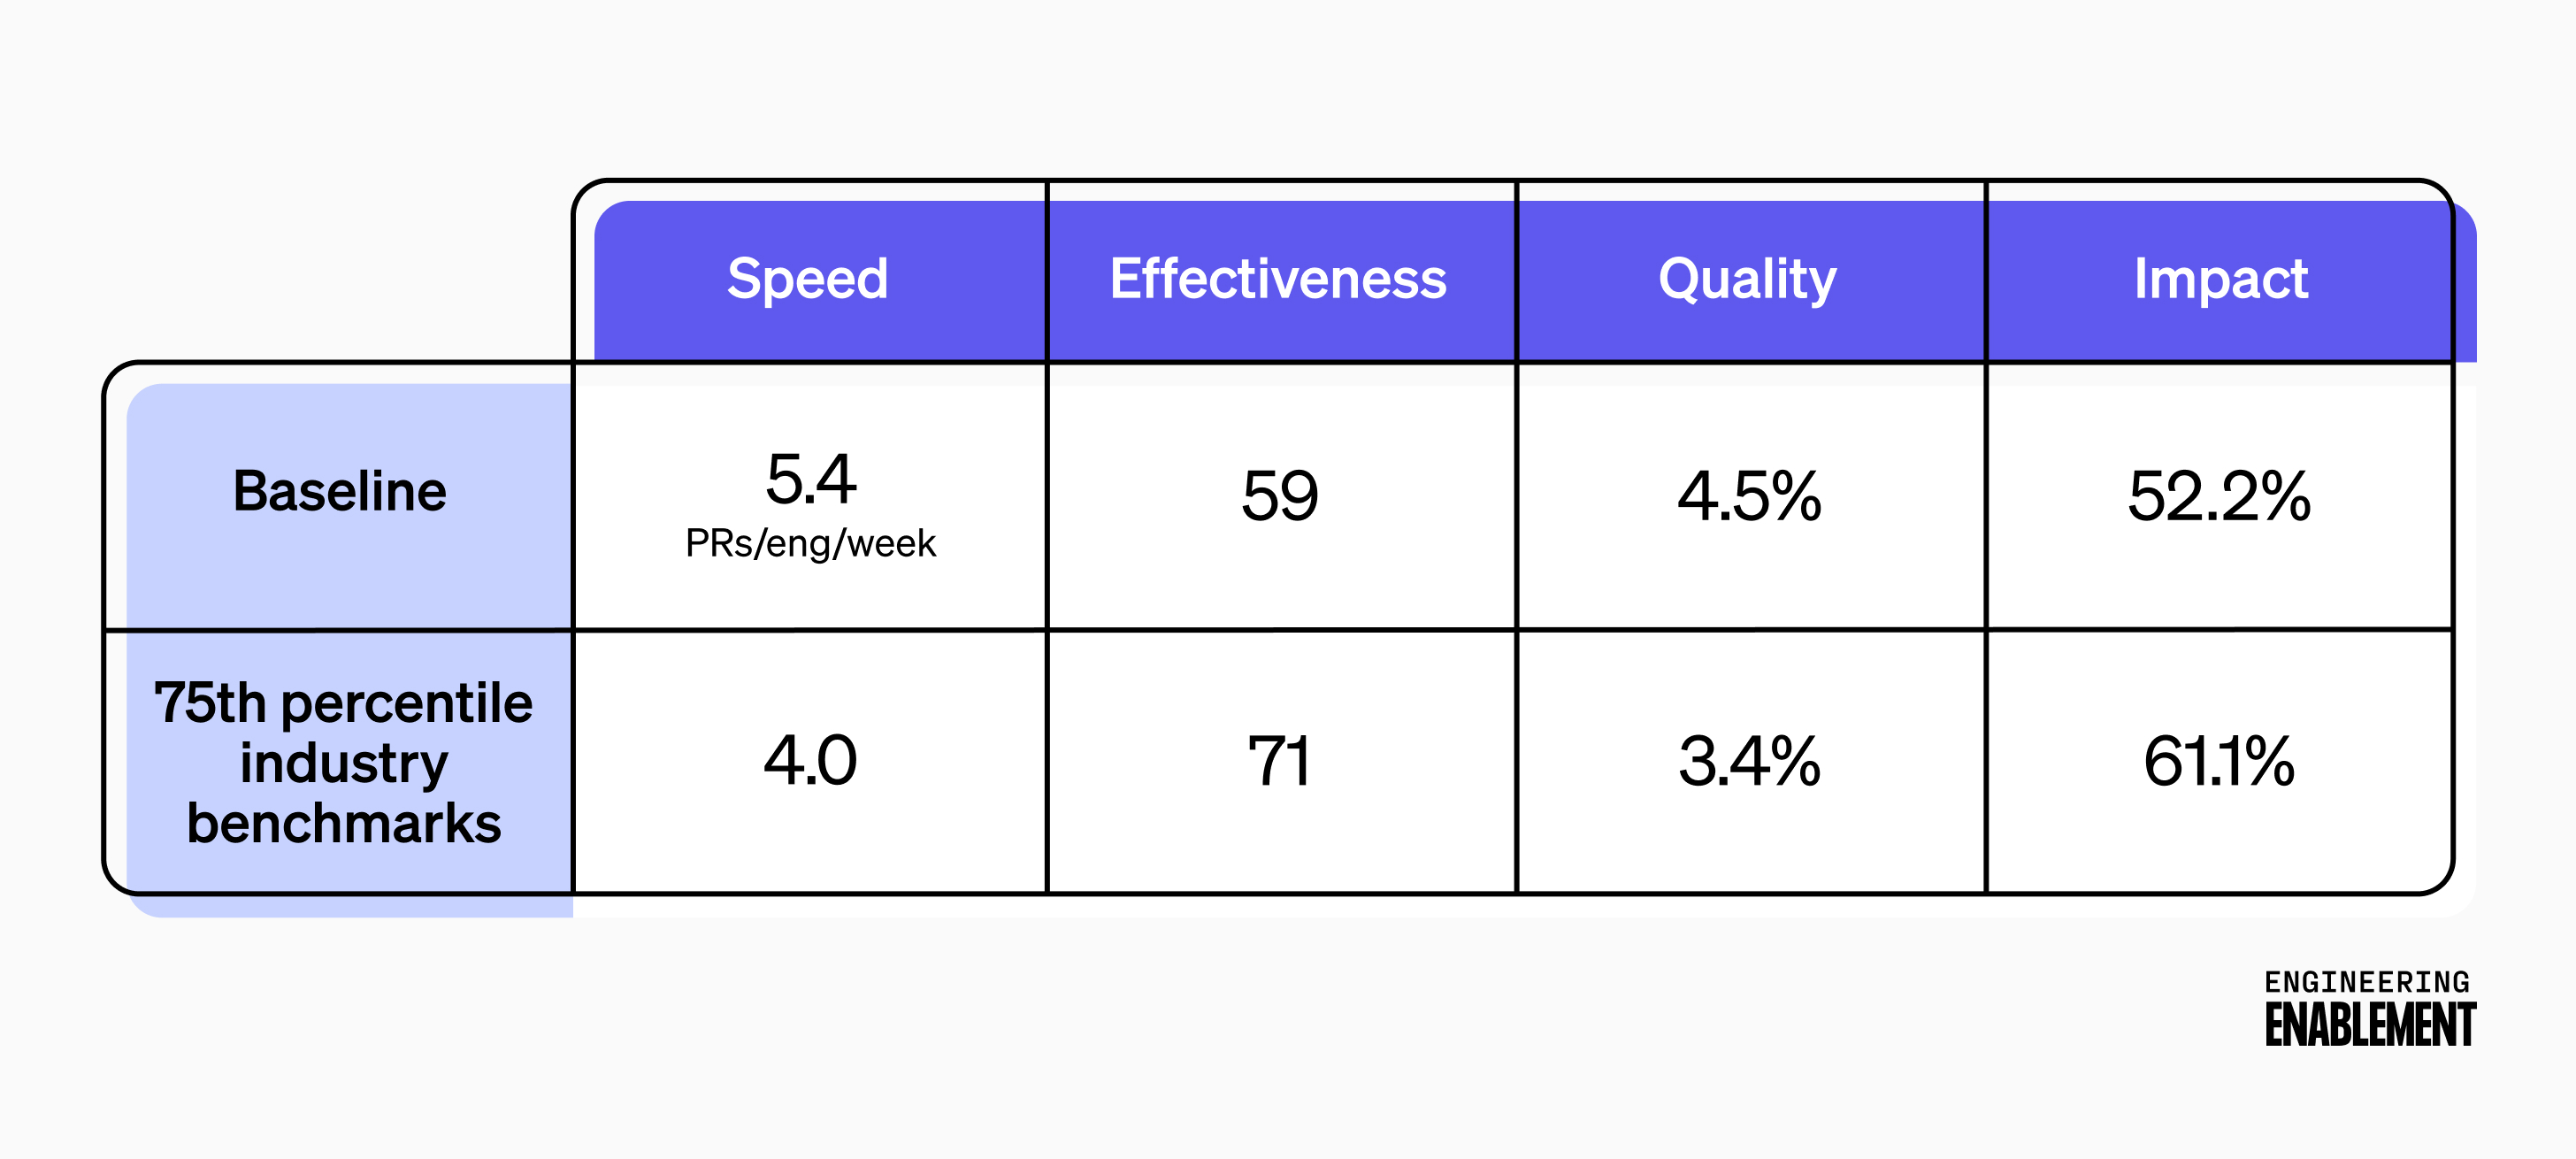
After looking into their data and using benchmarking data as a reference point (more on this later), the Developer Productivity team at this organization decided to focus on increasing Speed and Effectiveness to start. Their hypothesis was that Impact will increase in the long term, after a short dip to focus on these internal improvements.
To make this decision about what to work on to improve product velocity, they needed to drill down to the data on a team level, and also look at qualitative data from the engineers themselves. We encourage teams to triage their own results like this.
From the qualitative results in the survey, many developers reported that release processes were hindering their velocity. Based on this, the DevProd team knew they needed to make investments in their continuous integration (CI) tooling and release workflows. Their next step was to get support for this work.
Linking efficiency improvements to core business impact metrics
Instead of presenting these CI and release improvement projects as “tech debt repayment” or “workflow improvements” without clear goals and outcomes, you can use Core 4 to directly link efficiency projects back to core business impact metrics.
Ongoing research continues to show a correlation between developer experience and efficiency, looking at data from 40,000 developers across 800 organizations. Improving the Effectiveness score (DXI) by one point translates to saving 13 minutes per week per developer, equivalent to 10 hours annually. With this org’s 150 engineers, improving the score by one point results in about 33 hours saved per week.
This team also looked at supporting metrics to estimate the ROI of the projects they selected:
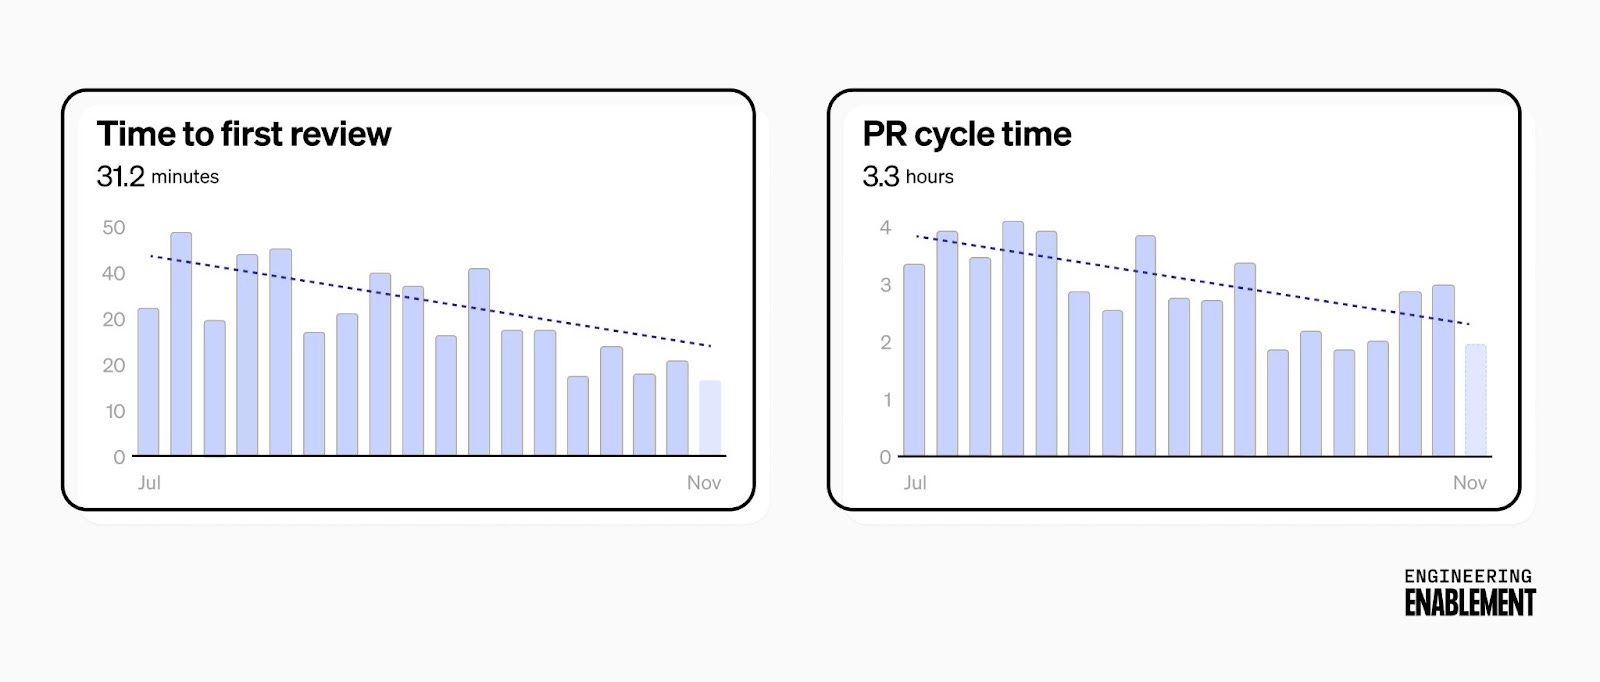
PR cycle time (the time from opening a PR to merging it) was about four hours. The time to first review was about 60 minutes. Reducing these times by 25% would eliminate over 1,000 hours of waiting time per week (150 devs * 5.4 PRs * 1.25 hours).
Flaky tests are rated the #1 priority from developers, so a targeted focus here would improve developer experience.
Targeting a three-point improvement to developer experience would mean recovering around 100 hours each week, equivalent to more than two full-time developers.
There are two ways to frame these estimates.
Money: Weekly salary for two developers is $9,600 in this scenario, so each week, improving these aspects of developer experience is worth at least that much, or a half a million dollars annually. The 1,000 developer hours spent waiting to merge PRs come in around $120,000 each week.
Time: You now have capacity to bring revenue-generating features to market faster, investing those two full-time developers or 1,000 hours of saved waiting time into something else.
Depending on the size and stage of your business, one of these frames may be more interesting to your teams and leadership.
Are these calculations perfect? Absolutely not.
Understanding the impact of these investments in terms of both time and money makes the stakes easier to understand when comparing these kinds of projects with new features, even if the comparison can never be apples to apples.
The math makes it clearer to see that delaying this investment would have meant giving up on three full-time employees’ worth of time savings. That might make sense in certain situations. But this organization made the choice to invest immediately, even if it meant delaying some new feature work. The time savings alone meant a quick return on investment, and the project also supported the longer-term goal of improving the Impact score and spending more time on innovation and experimentation.
Tracking velocity improvements with Core 4
Once you’ve got a baseline, you can start to regularly re-run the survey to track your progress. We recommend a quarterly cadence.
For this organization, the investment is already starting to pay off as predicted. Speed, Effectiveness, and Quality improved by making investments in their CI and release workflows. Impact took a temporary dip, as they expected, as work shifted away from new features to work on these improvements. In their next quarterly measurement, they hope to see the Impact score surpass previous levels.
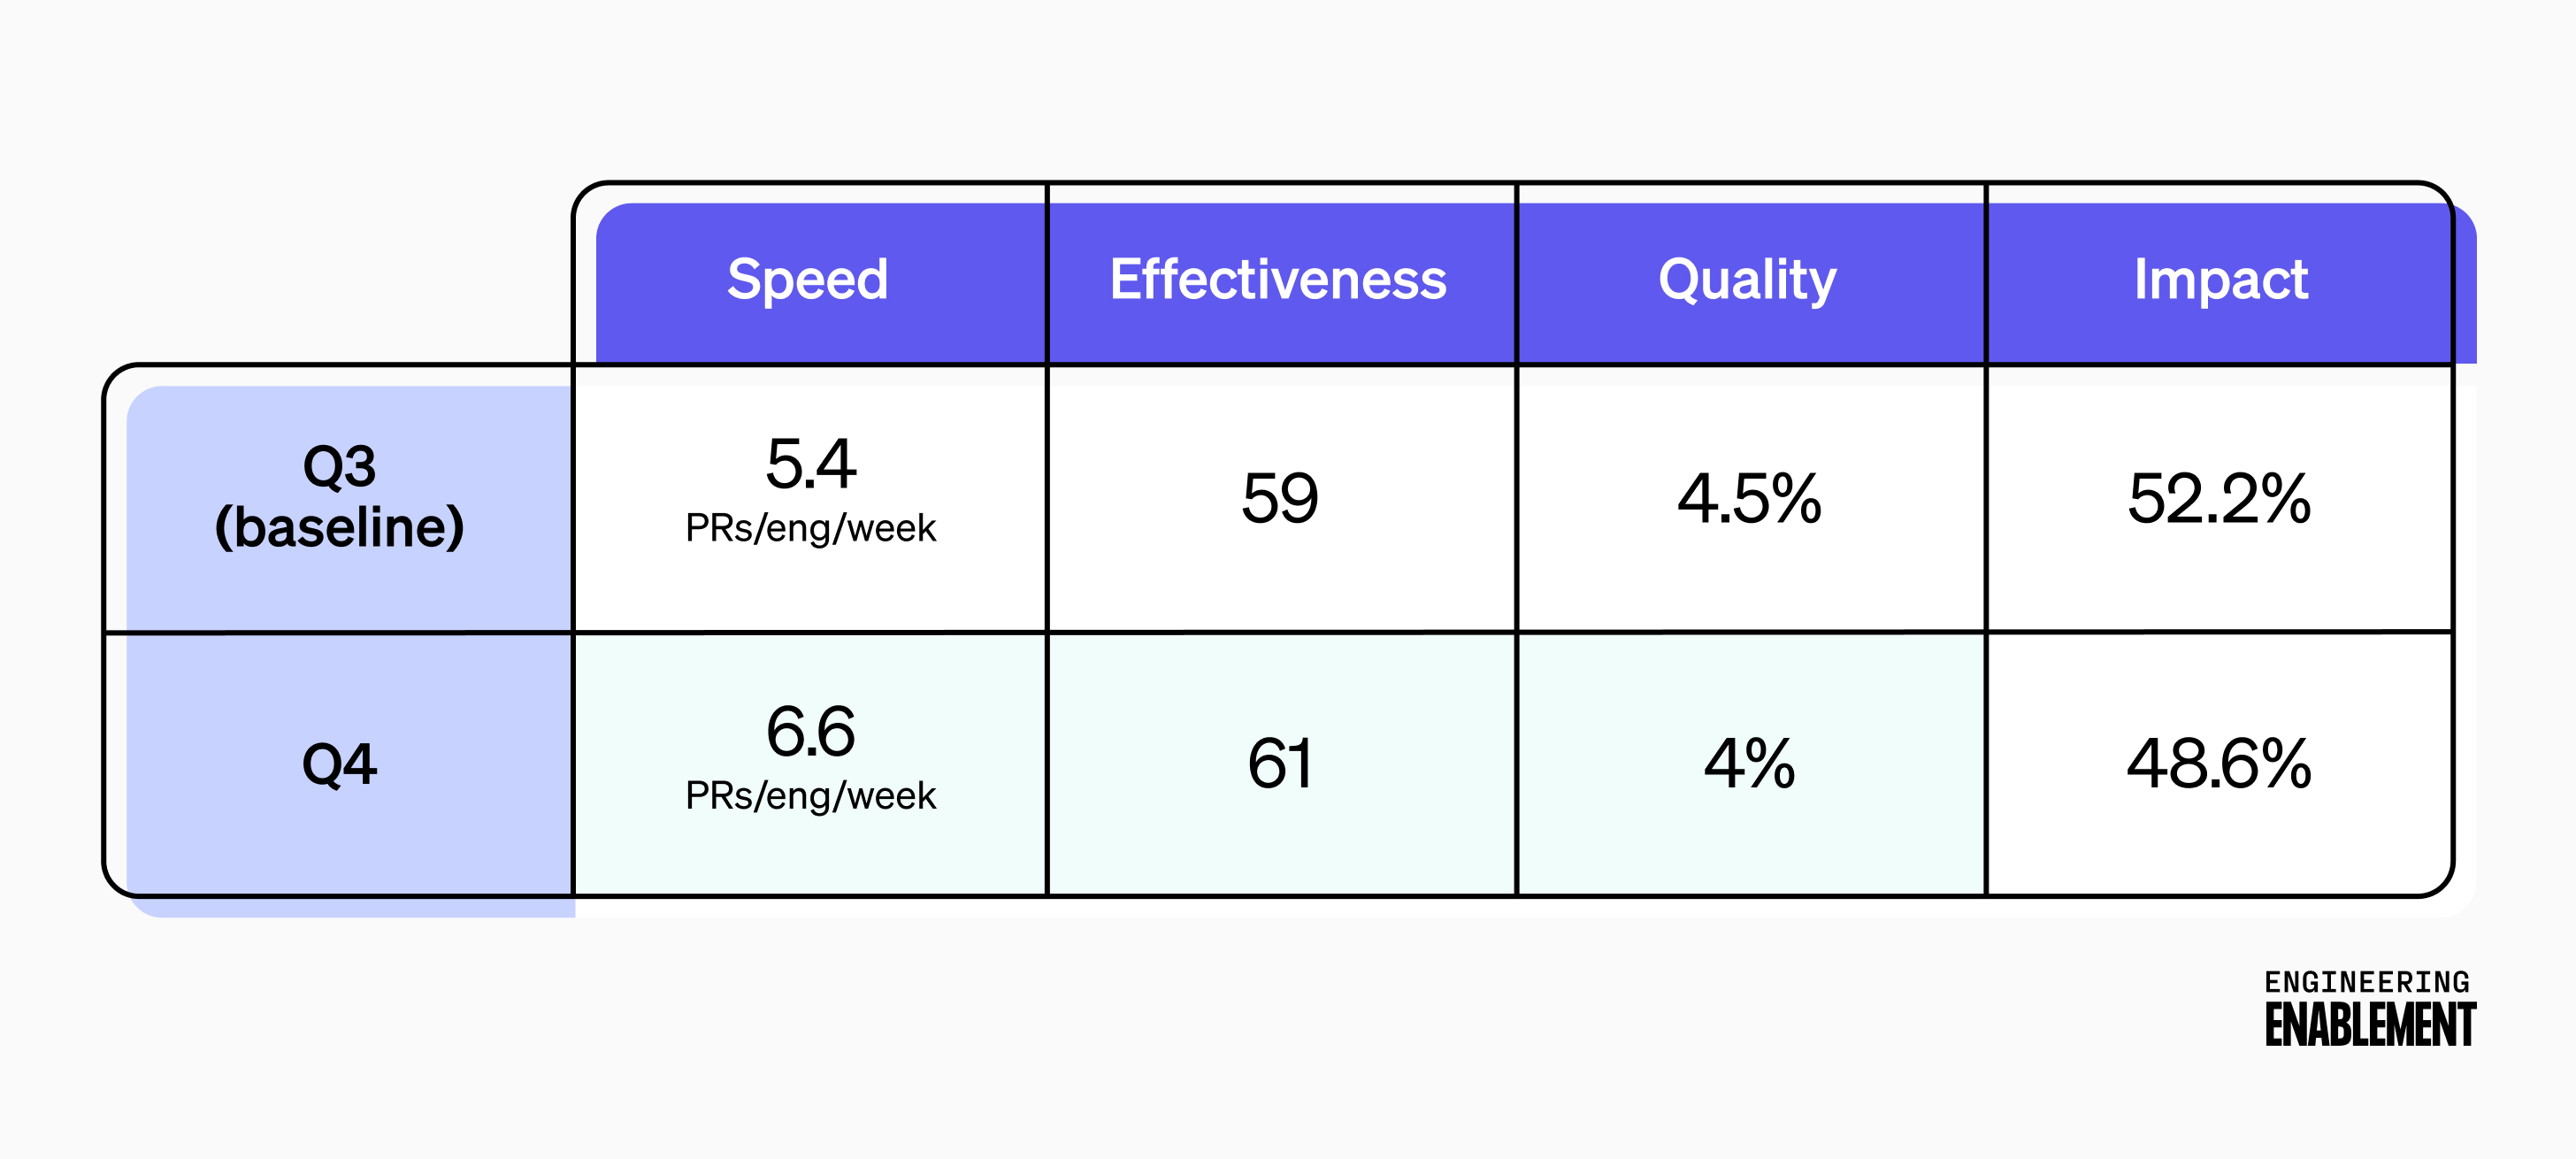
They did hit their target of reducing merge wait times by 25%, with the actual reduction of PR cycle time coming in around 40%. That surpasses their target of saving 1,000 hours of wait time, taking into account their improved Speed metric of 6.6 PRs per engineer per week.
Using benchmarks
Benchmarking data, both internal and external, will help contextualize your results. Remember, speed is only relative to your competition
Here are external benchmarks for the key metrics in the Core 4 framework. (Download benchmarking data here.)
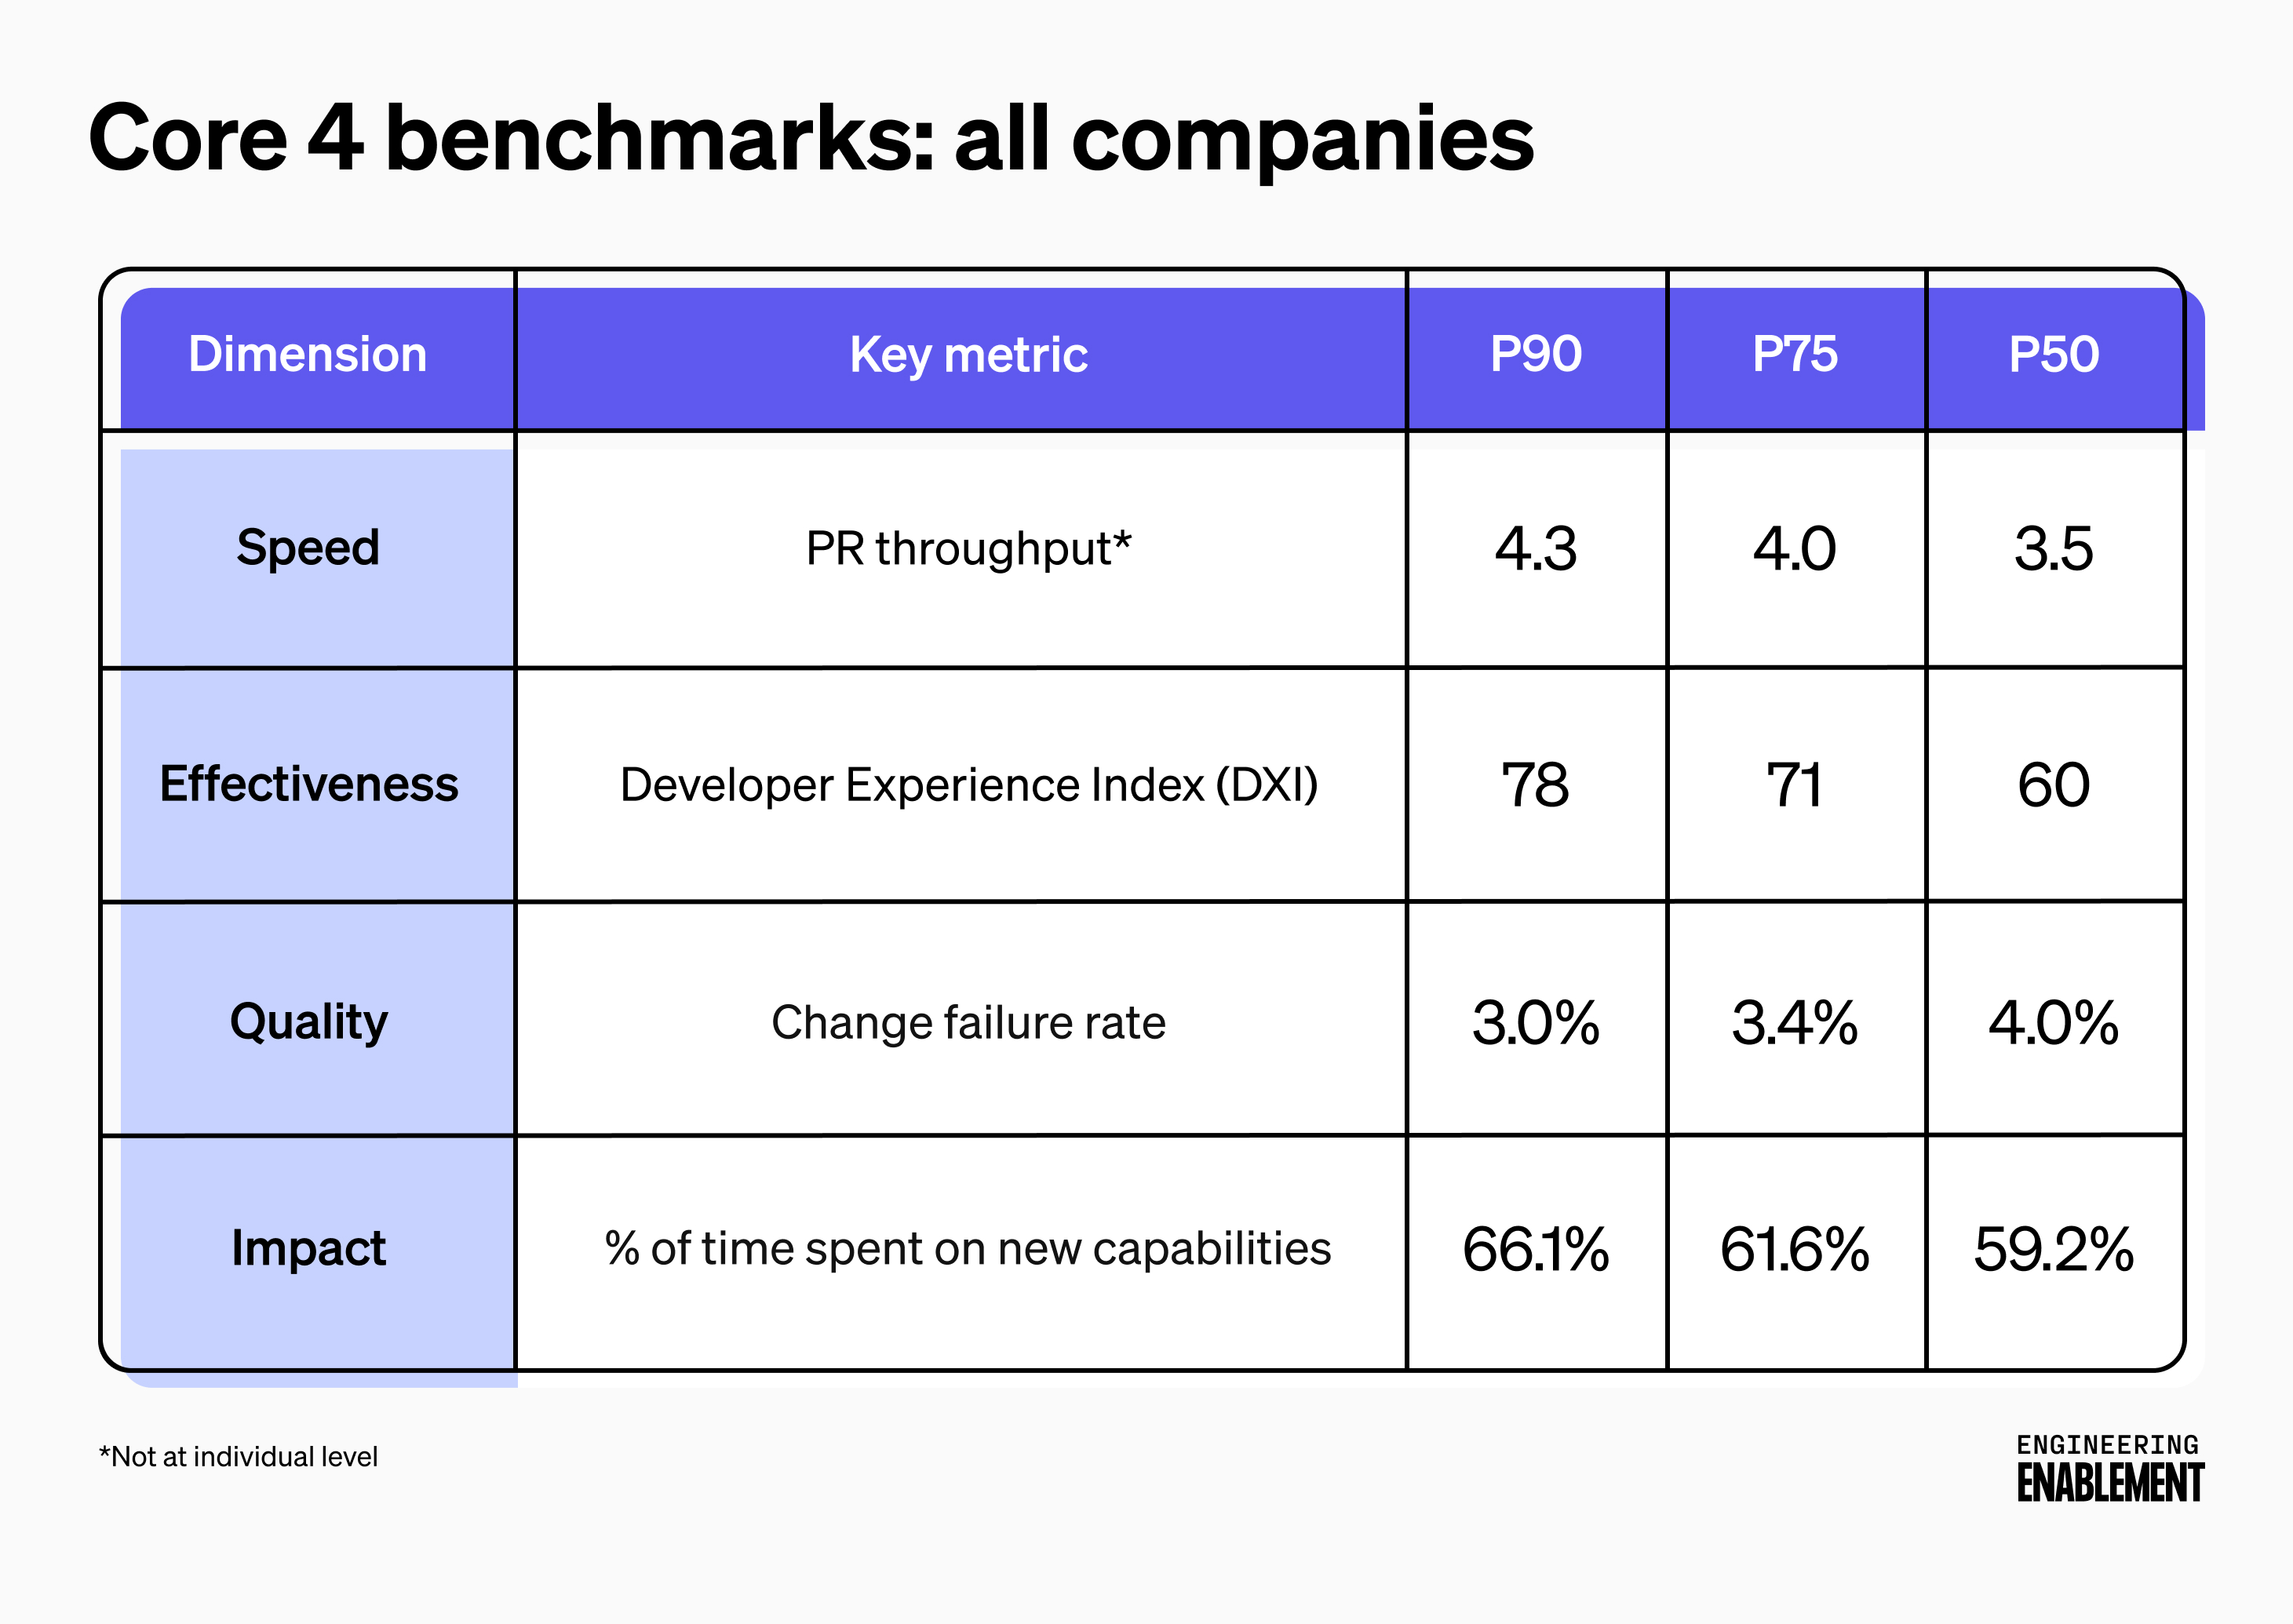
We recommend looking at 75th percentile values for comparison initially. Being a top-quartile performer is a solid goal for any development team.
External benchmarks are especially helpful for storytelling when presenting developer productivity work to executives and board members. Knowing how you are performing in the context of your competitive landscape can help strengthen the business case for new investment, and also protect current investment into areas of high performance.
Increasing velocity—or “moving faster”—is never done, but rather a horizon to chase. This habit of continuous improvement should repeat itself within your teams and across your organization and become part of the way that your company operates. With updated data, locate new areas of intervention, make new hypotheses, and repeat this process again.

Who’s hiring right now
This week’s featured job openings. See more open roles here.
Curriculum Associates is hiring a Principal PM - Platform Engineering | US
Pinterest is hiring a Senior PM - Infrastructure | San Francisco, CA
GitHub is hiring a Director of Software Engineering - DevEx | US
Lyft is hiring an Engineering Manager - DevEx | Toronto
The Hartford is hiring a Sr Staff Platform Engineer | Multiple cities, US
Thanks for reading. If you enjoyed this issue, consider sharing it.
-Abi
This is such a smart way to frame developer productivity. The second you start talking about time and money saved, leadership actually listens. That stat about saving 1,000 hours of PR wait time per week blew my mind makes you wonder how much time we’re all wasting without realizing it.